
Australian Financial Review, news.com.au, Daily Mail Australia, realestate.com.au, Canstar and Property Insights with Mark Bouris. Featured in more than 40 publications since 2022: explore our media appearances.
The vendor discount: sellers are settling for less, and how to tell which ones
The clearance rate tells you what sold. The vendor discount tells you what sellers actually settledfor, and right now it is the widest in Cotality's five-year series. Here is what it means in dollars, and the threesignals that show which side of it a property sits on.
What is a vendor discount?
The vendor discount is the gap between a property's first asking price and the price it sold for, as apercentage. Cotality publishes the median for each capital city and region every month, measured on completedsales over three months, so it shows what sellers accepted, not what they hoped for.
Watch first: Why Sellers Are Settling for Less Right Now (And How to Spot Them) (13 minutes): where the 4.4% comes from, the threesignals you can check tonight, and three ways people misuse the number.
Fast facts:
Australian vendor discounts and selling conditions (Cotality, RBA: 2026)
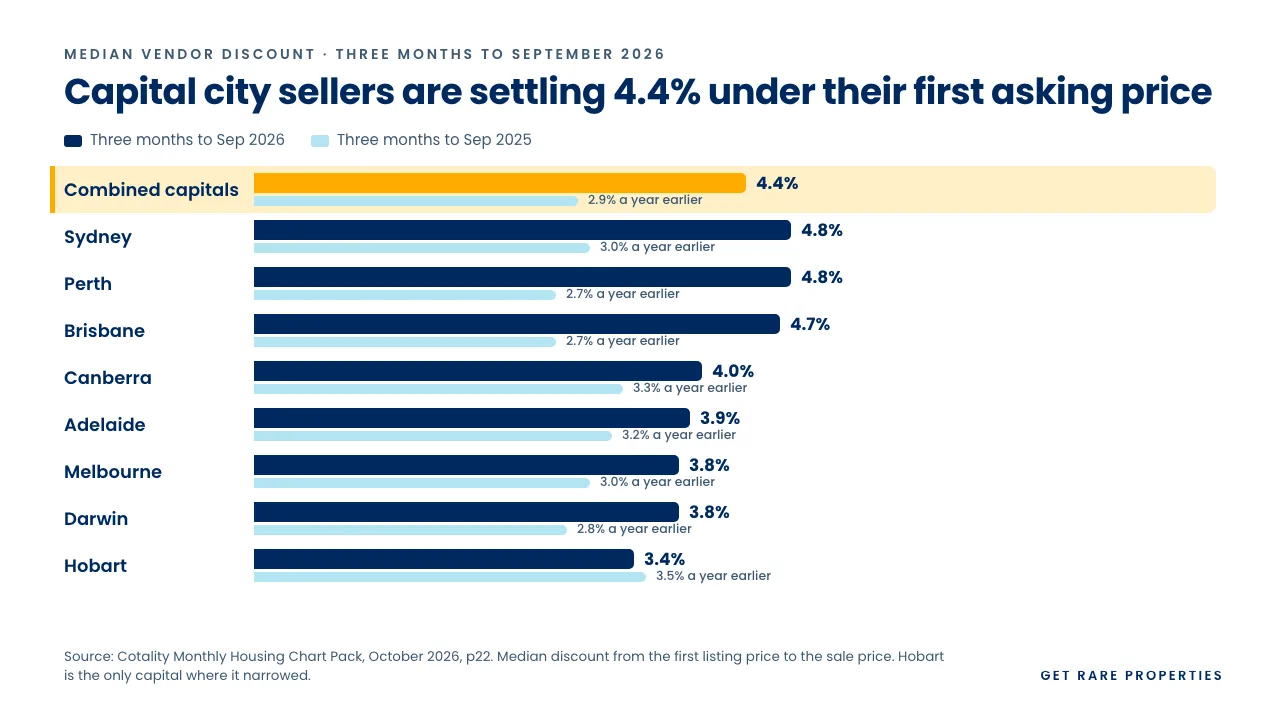
- The median vendor discount across the combined capitals was 4.4% over the three months to September 2026, the largest in the five-year series, against 2.9% a year earlier. (Source: Cotality Monthly Housing Chart Pack, October 2026, p22.)
- Regional discounts widened to 3.9%, the widest since January 2024, and the national figure rose to 4.2% from 3.2%. Since June, capital city discounts have exceeded regional ones, reversing a pattern that had held from late 2022. (Source: Cotality, October 2026 chart pack, p22.)
- Capital city homes took a median of 39 days to sell, against 23 a year earlier, the longest in the five-year series. Canberra was slowest at 50 days, Perth fastest at 26. (Source: Cotality, October 2026 chart pack, p21.)
- 39,747 homes sold nationally in September 2026, 20.9% fewer than a year earlier. New listings were down 7.9% while total listings were up 19.1%, over the four weeks to 11 October. (Source: Cotality, October 2026 chart pack, pp20, 23 and 24.)
- The cash rate is 4.60%, the fourth rise this year, and Cotality estimates the four rises since February have cut a median-income household's borrowing capacity by almost $90,000. (Source: RBA, 29 September 2026; Cotality, October 2026 chart pack, p35.)
- The combined capitals clearance rate finalised at 44.1% for the week ending 11 October 2026, the lowest since late June, against 68.2% a year earlier. (Source: Cotality final clearance rates, 15 October 2026.)
Short answer: the vendor discount is the gap between what a seller first asked and what they finally sold for. Across Australia's combined capital cities, the median vendor discount reached 4.4% over the three months to September 2026, the largest in Cotality's five-year series, up from 2.9% a year earlier. On a median capital city home that is just under $43,000. Three free signals help you work out which side of that median a property sits on: days on market, price history and listing history.
I'm Rasti Vaibhav, a CFA Charterholder, and I've bought 22 properties with my own money.
I now run an independent buyer's agency, so yes, a market where buyers have leverage is good for me. Hold that against me.
What is a vendor discount?
A vendor discount, sometimes called vendor discounting, is the difference between a property's original asking price and the price it sold for, written as a percentage. Cotality measures the median gap across sales that have already completed, over three months, so it is not a forecast.
Every month Cotality publishes its Monthly Housing Chart Pack. It is free, most people never open it, and page 22 almost never makes the headline.
Think of it as the difference between the sticker price and the drive-away price. Right now that gap is the widest it has been in five years.
How 4.4% turns into dollars
The median capital city home was worth about $974,000 at 30 September 2026, on Cotality's Home Value Index. 4.4% of that is just under $43,000. It is a rough size, because the two figures come from different releases.
Vendor discount by capital city, three months to September 2026
| Market | Discount, Sep 2026 | A year earlier | Days on market, Sep 2026 | A year earlier |
|---|---|---|---|---|
| Sydney | 4.8% | 3.0% | 46 | 29 |
| Melbourne | 3.8% | 3.0% | 42 | 28 |
| Brisbane | 4.7% | 2.7% | 38 | 17 |
| Adelaide | 3.9% | 3.2% | 37 | 32 |
| Perth | 4.8% | 2.7% | 26 | 11 |
| Hobart | 3.4% | 3.5% | 32 | 20 |
| Darwin | 3.8% | 2.8% | 39 | 40.5 |
| Canberra | 4.0% | 3.3% | 50 | 47 |
| Combined capitals | 4.4% | 2.9% | 39 | 23 |
| Combined regionals | 3.9% | 3.4% | 43 | 32 |
| National | 4.2% | 3.2% | 41 | 26 |
Source: Cotality Monthly Housing Chart Pack, October 2026, pages 21 and 22. Three months to September 2026 against three months to September 2025.
Perth and Sydney sit at 4.8%, Brisbane at 4.7%. Hobart is the only capital where the discount narrowed over the year. A city median is still a median, and the job is working out where one property sits inside it.
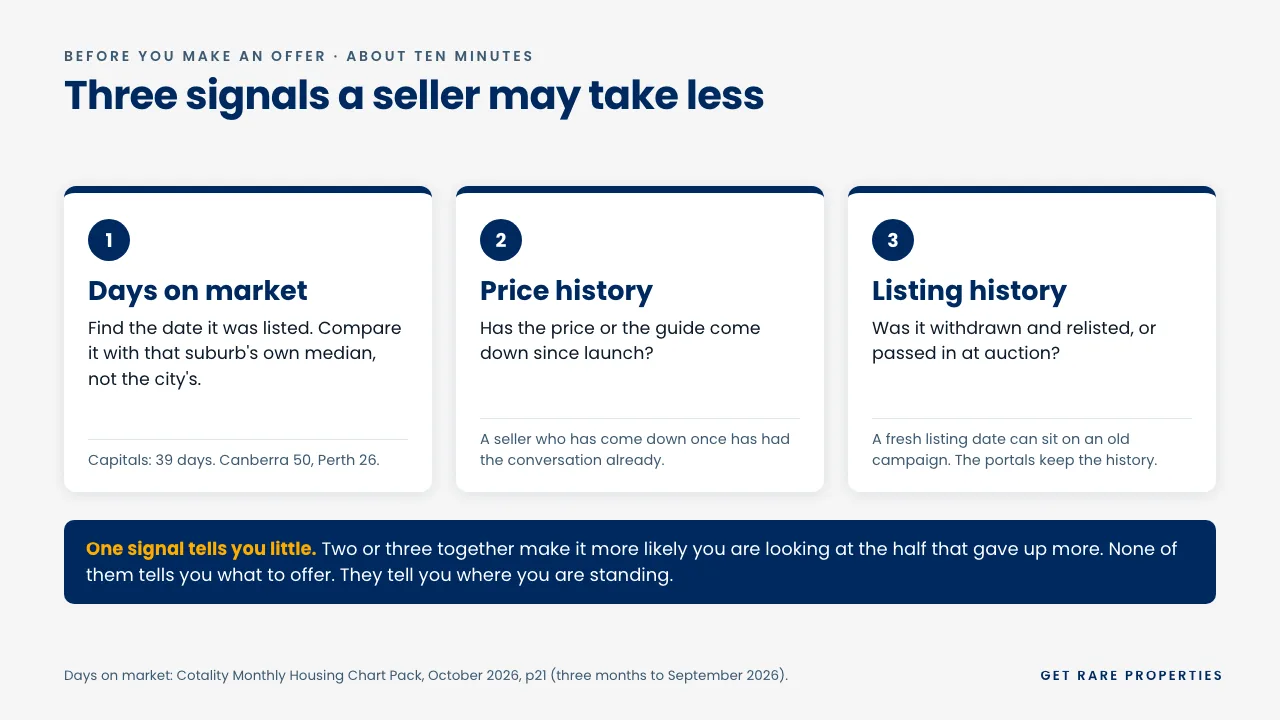
Three signals a seller may take less, checked on your phone
You're thinking: that's a median, not my property. Correct. Half of those sellers gave up less and half gave up more, and the whole job is knowing which half you're standing in front of. Here are three free signals I check. You can check them on your phone tonight.
1. Days on market
Open the listing and find the date it went up, then compare it with that suburb's own median. Capital city homes are taking a median of 39 days, but cities vary, and suburbs vary more again. Forty days is quicker than usual in Canberra and half as long again as usual in Perth. That comparison is what matters, and our scorecard method shows where to find a suburb's own figure for free.
2. Price history
Scroll down to it. Has the price or the guide come down since it launched? A seller who has already come down once has already had the conversation with themselves about coming down.
3. Listing history
Was it withdrawn and relisted, or passed in at auction? A fresh listing date on a property that was on the market in autumn is a fresh coat of paint on the same for-sale sign, and the portals keep the history.
If this sounds like work, it is, about ten minutes of it, and it is the ten minutes a lot of buyers skip because they treat the asking price as the real number.
One signal on its own tells you little. Two or three together make it more likely that the seller is flexible.
Run the decision on your own numbers at the free workshopBuy, Wait or Sell: free, 75 minutes, online, with live questions.
Why sellers are giving up more: fewer buyers, more stock, less borrowing power
Fewer buyers. About 40,000 homes sold across the country in September, down nearly 21% on September last year.
More stock sitting. Not because more people are selling: over the four weeks to 11 October, new listings were down 7.9% on a year earlier, and total stock was up 19.1% anyway. Think of a bath with the tap turned down and the drain half blocked. The water is rising, and it isn't because somebody opened the tap. It's because nothing is draining.
Less borrowing power. The Reserve Bank lifted the cash rate to 4.60% on 29 September, the fourth rise this year. Cotality estimates those rises have cut what a median-income household can borrow by almost $90,000.
Put those together and homes sit longer, and the longer they sit, the more sellers give up to get out. Cotality's Home Value Index for September put it this way: "Buyers generally have more choice, reduced urgency, and greater scope to negotiate, while vendors are having to become more realistic about their price expectations."
Vendor discount versus clearance rate: what each one actually measures
The clearance rate is the number everyone quotes, and it tells you almost nothing about what you will actually pay.
The combined capitals clearance rate finalised at 44.1% for the week ending 11 October 2026, the lowest since late June. The same week a year earlier was 68.2%. In Cotality's words, fewer than half of the homes taken to auction sold.
It does not tell you what a single one of them went for. A home that is passed in does not disappear. It goes back on the market with a price on it and gets negotiated, and the vendor discount is about that kind of negotiation: what a seller asked against what they took.
Think of the sold stickers going up on the signboards in your street. A clearance rate counts the stickers. It never tells you what price was on the board before the sticker went on. One is sentiment. The other is money.
Three ways people misuse the vendor discount
I'd rather you heard these from me. All three are behavioural mistakes more than maths mistakes.
1. Chasing the median. I have seen buyers walk into a negotiation and say, "The vendor discount is 4.4 per cent, so I'm offering 4.4 per cent under your asking price." The agent laughed. The seller felt insulted. The buyer lost the property. 4.4% is a market statistic, not a target.
2. Letting the discount choose the property. I have had buyers say, "I wasn't interested in this place, but it's been on the market sixty days, so maybe I can get a deal." That's backwards. The discount moves the price of something you had already decided to own. It doesn't make a bad buy a good one. Deciding whether to own it is the due diligence you finish before any offer.
3. Making an offer that only works if rates fall. If your offer only makes sense when the Reserve Bank cuts rates, you're not negotiating. You're speculating. And I wouldn't do that with my own money.
What this number cannot tell you
Nothing here says prices have bottomed. I don't know that, and I would be careful of anyone who says they do. Values across the property market are still falling, and the Reserve Bank hasn't ruled out more rises.
The number has limits of its own. It is a median of completed sales over three months, so it lags, and it mixes every kind of property in a market. The November chart pack is due in mid-November, and it could move either way.
Here is the question that matters if you are waiting: if prices fall further, will you still be able to borrow the same amount when they do? Your pre-approval doesn't wait for the bottom.
Buy, wait or sell: the question the signals can't answer
The three signals tell you which half of the market a property sits in. What they can't tell you is whether you should be making an offer at all right now, with your deposit, your borrowing capacity, in this rate cycle, on that property.
That is what the Buy, Wait or Sell workshop is for. It's free, it runs 75 minutes, and it's not about the market: it's about you. We run the decision on your numbers to help you make decisions with information and data. The goal is to leave knowing whether to buy, wait or sell.
Two clocks are already running. If you have a pre-approval sitting in your inbox, its expiry date is your real deadline, not mine. And this is October's number: if you're going to use 4.4%, use it while it's true.
Can't make it live? Register anyway and the replay comes to you, though you miss the live questions, where you can put your own question to me.
Save a seat at the Buy, Wait or Sell workshopFree, 75 minutes, online. Register and the replay comes to you if you can't make it live.
Because the worst decision isn't buying too early or too late. It's making no decision at all while your pre-approval expires.
Video transcript: Why Sellers Are Settling for Less Right Now (And How to Spot Them)
Figures and statements reflect what was said at the time of recording. Transcript adapted from the video captions, with punctuation and paragraph breaks adjusted for readability.
Read the full transcript (2,142 words)
Three weeks ago, a buyer walked into a negotiation and said, "The vendor discount is 4.4%, so I'm offering four point four percent under asking." The agent went quiet. The seller hung up. The property sold four days later to someone else for forty thousand dollar more than that buyer offered. The number was real. Quoting it back was a mistake. Here's what to check instead on your own phone tonight. Last weekend, fewer than half the homes at auction across our capital cities sold. The clearance rate finalized at 44.1 percent, the lowest since late June. The headlines called it a disaster for sellers.
But across the capitals, the typical seller is now settling 4.4 percent under what they first asked. That's just under forty-three thousand dollars on a median city, city home and the biggest discount in five years. A clearance rate tells you what sold. The vendor discount tells you what a seller actually settled for. One is sentiment, the other is money. I'm Rasti Vaibhav. I've bought twenty-two properties with my own money, and I now run an independent buyer's agency. So yes, a market where buyers have a leverage is good for me. Hold that against me for the rest of this video. Three things.
Where that 4.4 percent comes from and what it means in dollars. The Three-Signal Test, which tells you which side of it the property you are watching sits on and what to do with it in the next ten minutes if you have a pre-approval sitting in your inbox with an expiry date on it. Now, where does that 4.4 percent come from? Every month, CoreLogic, the company behind the Home Value Index, publishes the Housing Chart Pack. It's free, it's public, and it sits behind the headlines, not in them. If you have never heard of a vendor discount, that's not on you.
The vendor discount is the gap between what a seller first asked and what they actually sold for. It's not a forecast. It is measured on completed sales. On page 22 of the October Chart Pack, the median discount across the combined capitals reached four point four percent over the three months to September. Cotality's own words: its highest level in five years. A month earlier, it was 4.2 across the regions, it's 3.9. Now, put a number on that. The median capital city home was worth about nine hundred and seventy-four thousand dollars at the end of September.
And 4.4 percent of that is just under forty-three thousand dollars. That's a rough size because the two figures come from different releases. It's the difference between the sticker price and the drive-away price. You're thinking, "That's a median. That's not my property. "Correct. Half of those sellers gave up less than that, and half gave up more. And the whole job is knowing which half you're standing in front of. So here's a three-signal test. Three free signals I check, and you can check them on your phone tonight. And the third one is the one most buyers miss. One. Days on market.
Open the listing and find the date it went up, then compare it with that suburb's own median. Capital city homes are taking a median of thirty-nine days right now, but the cities are far apart. Canberra homes taking fifty and Perth homes twenty-six, and suburbs vary more again. So forty days is quicker than usual in Canberra and half as long again as usual in Perth. If you have stood in a kitchen on a Saturday and wondered why nobody else turned up, you were reading the signal without a number on it. Two. The price history. Scroll down to it.
Has the price or the guide come down since it's launched? A seller who's already come down once has already had the conversation with themselves about coming down. Three. The listing history. Was it withdrawn and relisted or pass in at auction? A fresh listing date on a property that was on the market in autumn is a fresh coat of paint on the same for sale sign, and the portals keep the history. There's a one most buyers miss. If you're thinking this sounds like work, it is, about ten minutes of it.
It's an easy ten minutes to skip because the asking price looks like the real number. One signal on its own tells you little. Two or three together make it more likely you're looking at the half that gave up more. That's the Three-Signal Test. None of them tells you what to offer. They tell you where you're standing. Quick note: if you want to know what this means for your own situation, your deposit, your borrowing capacity, this rate cycle, the free Buy, Wait, or Sales workshop is linked below. I'll come back to it at the end.
Let me show you all three on one listing and the moment where the buyer had to choose. This is not a real client, and the prices are made up, but it's realistic shape for right now Say it's a one-bedroom apartment in Manly, listed with a guide of $1.2 million. It's passed in at auction in week two, and the guide drops to $1.15 million. By day fifty-two, it's still there. And one-bedroom apartments in Manly have been selling in a median of about twenty-eight days. All three signals. The buyer opens at $1.02 million. The agent says, "That's going to offend them.
We need to come up. "The tempting move at the moment is to jump straight to $1.08 million. This buyer waited. They said, "That's our offer. Let us know. "Three days later, the seller counters at one point zero eight, and they settle at $1.055 million. That's ninety-five thousand under the asking price and one hundred and forty-five thousand under where it started. Notice what this buyer didn't do. They didn't go 4.4 percent at the agent, and they didn't jump when the agent pushed. They checked the three signals, made the offer, and let the seller make the next move.
It is not a formula, and it is not typical. It's what patience looks like when the signals say a seller has already had the conversation with themselves about coming down. The buyers who missed it, they walked through that open home, saw 1$.15M, and believed it. So why is this happening? Picture this. Fewer buyers. More stock. Less borrowing power. And each one feeds the next. Fewer buyers. About forty thousand homes sold across the country in September, down nearly twenty-one percent on September last year. More stock sitting. Not because more people are selling.
New listings are down seven point nine percent and total stock is up nineteen point one percent anyway. Think of a bath with the tap turned down and the drain half blocked. The water's rising, and it isn't because somebody opened the tap. It's because nothing is draining. Less borrowing power. The cash rate has been four point six percent since thirtieth of September, the fourth rise this year. Cotality estimates those rises have cut what a median income household can borrow by almost ninety thousand dollars. Put those together: Fewer buyers, less borrowing power, homes sitting longer.
And the longer they sit, the more sellers give up to get out. And this isn't just me saying it. Here's Cotality's Home Value Index for September, word for word. Buyers generally have more choice, reduced urgency, and greater scope to negotiate, while vendors are having to become more realistic about their price expectations. Now back to clearance rates because it's the number in the headlines, and on its own, it doesn't tell you what you'll actually pay. It counts the auctions. It doesn't price them. You have seen the clearance rates.
Last weekend finalised at 44.1 percent across the capitals, the lowest since late June. The same weekend last year was 68.2. Cotality's own words:"Fewer than half of the homes taken to auction sold. "Here's what it actually tells you. More than half the homes that went to auction didn't sell. It doesn't tell you what a single one of them went for. A home that's passed in doesn't disappear. It goes back on the market with a price on it and gets negotiated. And the vendor discount is about that kind of negotiation: what a seller asked against what they took.
If you remember one thing from this video, make it this. Think of the sold stickers going up on the signboards in your street. A clearance rate counts the stickers. It never tells you what price was on the board before the sticker went on. And if you've felt the headlines and your own Saturdays disagreeing, this is the gap between them. Now, three ways people misuse this number because I'd rather you heard them from me. If you've done one of them already, you're not alone. One. Chasing the median.
Remember the buyer at the start, the one who quoted 4.4 percent back to the agent? 4.4 is a market statistics, not a target. A seller who hears it quoted back hears a buyer who hasn't done the work. Two. Letting the discount choose a property. I've had buyers say, "I wasn't interested in this place, but it's been on the market sixty days, so maybe I can get a deal. "That's backwards. The discount moves the price of something you had already decided to own. It doesn't make a bad buy a good one. Three. Making an offer that only works if rates fall.
If your offer only makes sense when the Reserve Bank cuts rates, you're not negotiating. You're speculating, and I wouldn't do that with my own money. And one honest limit on all of it. Nothing in this video says prices have bottomed. I don't know that, and I would be careful of anyone who says they do. Values are still falling, and the Reserve Bank hasn't ruled out more rises. But here's the question that matters: if you are waiting for prices to fall further so you can afford more, will you still be able to borrow the same amount when they do?
Because those four rises have already cut what a median income household can borrow by almost ninety thousand dollars, and your pre-approval doesn't wait for the bottom. So here's what happens next. You now know the Three-Signal Test, the three signals that tell you which half of the market a property sits in. Days on market, price history, listing history. Tonight, pick one property you have been watching and check them.
When you have done it, tell me in the comments which signals it showed But here's what those three signals don't tell you: whether you should be making an offer at all right now with your deposit, your borrowing capacity in this rate cycle on that property. That's what the Buy, Wait, or Sell workshop is for. It's free, it runs seventy-five minutes, and here's what we'll do: i'll walk you through the exact decision framework I use with my own clients, the one that tells you whether to buy, wait, or sell based on your deposit, your borrowing capacity, and your timeline.
Not the market's. Yours. About twelve hundred people have taken it. The goal is to leave knowing whether this is your window. And two clocks are already running. Clock one: if you have a pre-approval sitting in box, its expiry date is your real deadline, not mine. Every week you wait is a week closer to reapplying, and rates haven't moved down. Clock two: this is October's number. The next chart pack comes out next month. It could move either way. If you're going to use 4.4 percent, use it while it's true. Can't make it live?
Register anyway: the replay comes to you, but here's what you miss: the live questions. That's where you put down your own question to me, and the recording can't. The link is below, and if you've been scrolling listings every Sunday night, wondering whether you are early or late, this is where you work that out on your own numbers. Because the worst decision isn't buying too early or too late. It's making no decision at all while your pre-approval expires. Let's figure out whether this is your window. General information only.
I'm a licensed bus agent, not a financial or tax advisor, so please check anything that affects your money with your own advisor. Nothing here is a recommendation on any property or suburb. The number is on page 22 of the chart pack. Now you know where to look. See you in the next one.
General information only. We're licensed buyer's agents, not financial or tax advisers, so please check anything that affects your money with your own adviser.
Frequently asked questions
What does vendor discount mean?
A vendor discount is the gap between a property's first asking price and its final sale price, as a percentage. Cotality reports the median over three months of completed sales, so it measures what sellers actually accepted, not what they hoped for.
What is the vendor discount in Australia right now?
The median vendor discount was 4.4% across the combined capitals over the three months to September 2026, the largest in Cotality's five-year series. Regional markets were at 3.9% and the national figure was 4.2%, up from 3.2% a year earlier.
How is a vendor discount calculated?
Take the first listed price, subtract the sale price, and divide by the first listed price. A home first listed at $1,000,000 that sells for $956,000 has a 4.4% discount. Cotality then takes the median across all sales in a market over three months.
What is a good vendor discount?
There is no good number in isolation. A discount means more when you compare it with the same market a year earlier and with the property's own days on market, price history and listing history. It is a statistic about market conditions, not a target for an offer.
Should I offer 4.4% under the asking price?
No. 4.4% is a median across thousands of sales, and half of those sellers gave up less. Quoting it back to a seller tells them you haven't looked at their property's own evidence.
What does passed in at auction mean?
A property is passed in when bidding at auction does not reach the seller's reserve price, so it does not sell on the day. It often goes back on the market with a price and is negotiated privately, which is why a low clearance rate does not tell you what homes sell for.
What affects the size of a vendor discount?
Supply and demand, mostly: how many buyers there are, how much stock is sitting unsold, and how much buyers can borrow. Right now all three point the same way. September sales were down 20.9% on a year earlier, and total listings in the four weeks to 11 October were up 19.1%. Cotality estimates the four rate rises since February have cut a median-income household's borrowing capacity by almost $90,000. The first asking price matters too, because an ambitious one leaves more room to come down.
Does a bigger vendor discount mean prices have bottomed?
No. It measures how far sellers came down on completed sales; it says nothing about where values go next. Values were still falling at September 2026, and the Reserve Bank had not ruled out further rate rises.
General information only. We're licensed buyer's agents, not financial or tax advisers, so please check anything that affects your money with your own adviser. Market figures are Cotality's and the RBA's, dated where they appear, and they will change with the November releases. Nothing on this page is a recommendation on any property or suburb, and the Manly example is an illustration with made-up prices, not a real client or a real sale.
Sources: Cotality, Monthly Housing Chart Pack October 2026, published 15 October 2026 (vendor discount p22, days on market p21, sales p20, listings pp23 to 24, mortgage rates p35) · Cotality, Home Value Index, September 2026 data, published 1 October 2026 · Cotality, Final clearance rates week ending 11 October 2026, published 15 October 2026 · RBA, Statement by the Monetary Policy Board, 29 September 2026 · Get RARE, Sellers Are Settling for Less Right Now. How to Tell Which Ones, YouTube, 27 October 2026
Don't make an offer on a median. Run the decision on your own numbers.
Buy, Wait or Sell is a free 75-minute online workshop, and it's not about the market: it's about you. We runthe decision on your numbers to help you make decisions with information and data. The goal is to leave knowingwhether to buy, wait or sell.
Come live to put your own question to Rasti. Can't make it? Register anyway and the replay comes to you.
No fluff, just strategy.
Save your seat
Buy, Wait or Sell: free, 75 minutes, online, with live questions.
Save my seat at Buy, Wait or SellFree. Unsubscribe from anything we send in one click.
Get RARE Properties is Featured On
Get RARE Properties is Featured On

About the author
Rasti Vaibhav is the founder of Get RARE Properties, an independent buyer's agency for property investors. He is a CFA Charterholder and spent more than nine years managing institutional portfolios at Westpac and AMP Capital before founding the firm in 2020. He sits on the REINSW Buyers' Agent Chapter Committee and is the author of The Property Wealth Blueprint.
Related Articles
Related Articles